
How to Benchmark for Scale
JP's Profitable Growth - Vol 04

Hi (👋 ), welcome back to a new edition of Profitable Growth, an operator's newsletter for operators, at the cross-section of AI, operating cultures and financial discipline.
In this week's edition (est. 7 min. read):
Main Article
Quick Hits
Number to Know

The Advantages of Benchmarking to Scale Your Startup
Scaling a tech startup can feel like you're continuously changing the parts of a plane while it's flying. Founders, executives and board members are constantly navigating the tension between growth and sustainable operations.
Having been in the financial and operational trenches during hyper-growth phases at startups like ServiceTitan, DISQO, and MarketShare, I've learned that strategic benchmarking is far more than just comparing numbers. It's a critical navigational tool. But how, what, and why you benchmark makes all the difference.
Many leaders fall into traps: chasing vanity metrics, drowning in data (analysis paralysis!), or applying generic benchmarks that don't fit their unique context. The key isn't just data; it's the insights powered by a combining operational rigor and financial acumen, grounded in first principles.
🤔 Why Most Benchmarking Falls Short
Before diving into the "how," let's address the "how not to." Benchmarking fails when:
It's untethered from your strategy: measuring things just because you can, without linking them directly to your core strategic priorities (your North Star, OKRs).
It's a "vanity" metric: focusing solely on metrics that look good on the surface (e.g., raw user growth) without scrutinizing the underlying health (e.g., engagement, retention, unit economics).
It lacks context: applying generic industry averages without considering your specific stage, business model, market dynamics, or funding environment.
It creates fear, not focus: using benchmarks punitively rather than as tools for learning, improvement, and celebrating progress. In people-first cultures, integrity and trustworthiness are key – benchmarks should illuminate, not intimidate.
It ignores the operational plumbing: Focusing only on high-level financial outcomes without benchmarking the operational processes that drive them. At MarketShare, for example, scaling hosting costs required a deep dive into operational analytics, not just the final bill.
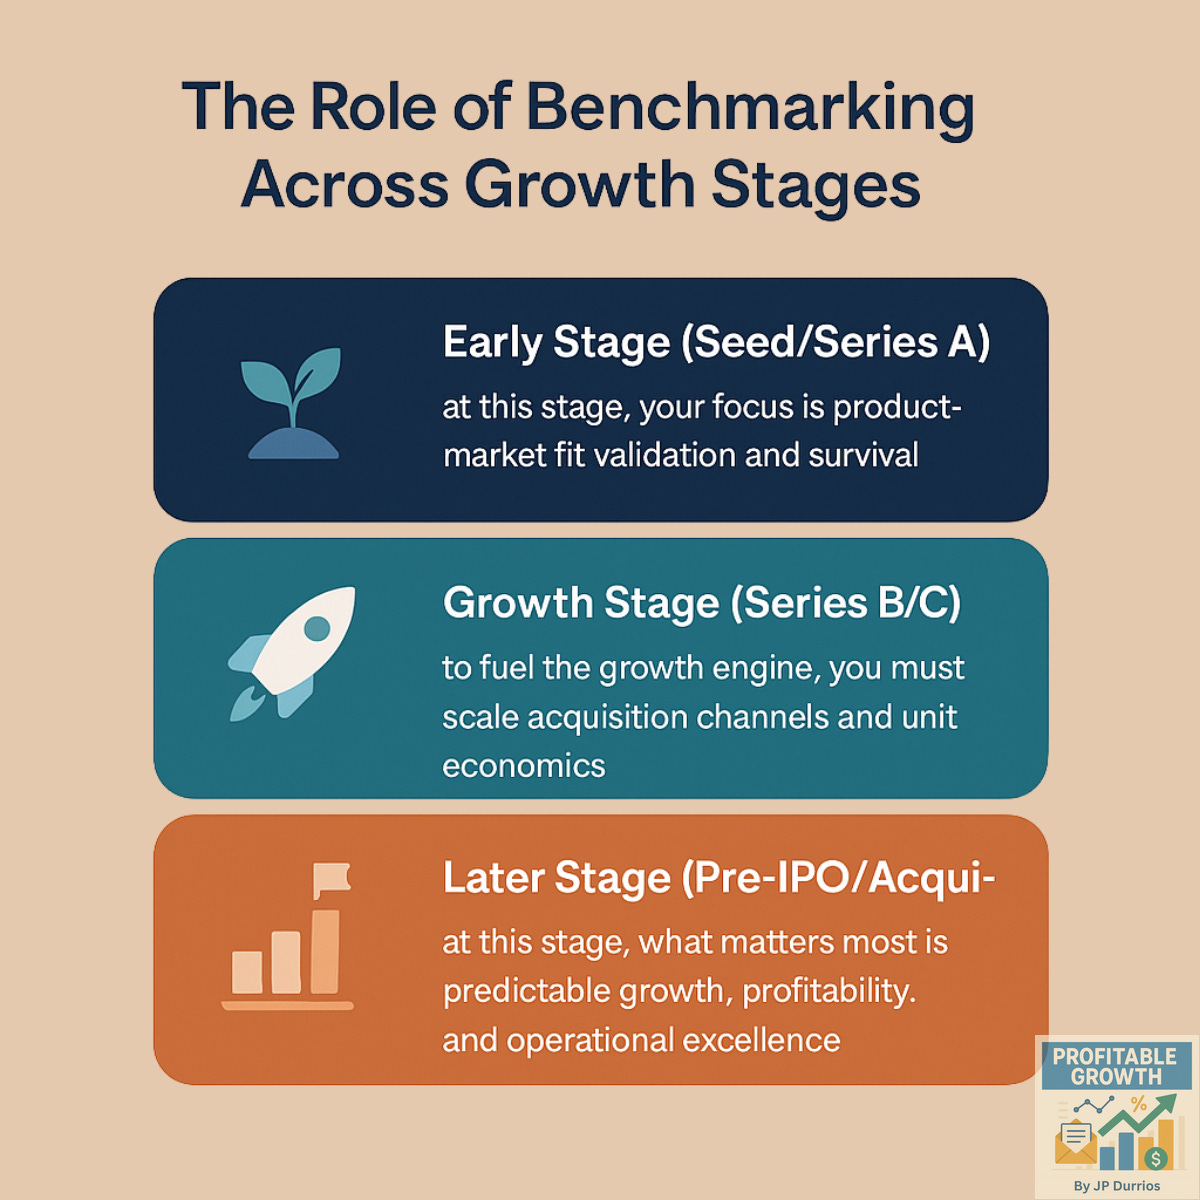
📈 The Role of Benchmarking Across Growth Stages
The metrics that matter most change as your company grows. Applying late-stage metrics too early burns cash and focus; sticking with early-stage metrics too long invites inefficiency.
Early Stage (Seed / Series A)
At this stage, your focus is product-market fit validation and survival (Gilion, TaxFyle).
Sample Key Metrics:
User Growth & Engagement: Are people using the product? Are they sticking around? (e.g., DAU/MAU, session length, feature adoption).
Customer Acquisition Rate: How quickly are you adding initial customers? How viral is your app?
Early Churn Indicators: Why are the first users leaving?
Burn Rate & Runway: The non-negotiable reality check. How long can you sustain operations?
Qualitative Feedback: What are customers saying? This is crucial data!
At Overture, in the pioneering days of paid search, understanding early user adoption and feedback loops was paramount for survival and informing rapid international expansion.
Are your early metrics telling a coherent story about market reception and operational viability?
Growth Stage (Series B/C)
To fuel the growth engine, you must scale your acquisition channels and unit economics (Crazy Egg).
Sample Key Metrics:
Customer Acquisition Cost (CAC) vs. Lifetime Value (LTV): The golden ratio. Is your growth profitable and sustainable? Aim for LTV > 3x CAC.
Net Revenue Retention (NRR): Are you growing with your existing customers? Crucial for SaaS. Aim for >100%.
Sales Cycle Length & Conversion Rates: How efficient is your GTM engine?
Gross Margin: Are you building a fundamentally profitable business? How are your growing AI costs impacting your plans? That's a new expensive that is getting more prevalent.
Burn Multiple: How efficiently are you converting invested capital into net new ARR? (Net Burn / Net New ARR). Lower is better.
Team Velocity & Output (R&D): Are you shipping valuable features efficiently?
ServiceTitan's journey past $100M ARR was driven by a relentless focus on SaaS metrics like NRR and disciplined financial management, which underpinned our growth.
Are your unit economics scaling positively alongside your top-line growth? Where are the bottlenecks in your growth engine? Are you keeping an eye on your AI expense line?
Later Stage (Pre-IPO / Acquisition)
At this stage, what matters most is predictable growth, profitability, and operational excellence.
Sample Key Metrics:
Sustainable Revenue Growth Rate: Demonstrating predictable, efficient expansion.
Rule of 40: A cornerstone metric combining your growth rate with your profit margin (EBITDA or FCF Margin). If greater than 40%, you’re considered a good investment.
Operational Efficiency Ratios: Sales & Marketing efficiency, R&D leverage, G&A cost control.
Working Capital Velocity: How efficiently are you converting cash?
Market Share & Competitive Positioning: Validating leadership and defensibility.
Achieving SaaS-grade gross margins and preparing MarketShare for our acquisition by Neustar required meticulous attention to operational efficiency and robust financial reporting.
Does your financial and operational performance tell a compelling story of durable value creation for potential investors or acquirers?
👩🎨 Avoiding Analysis Paralysis - The Art of Focused Execution
A common trap is getting lost in the data ocean. Benchmarking should catalyze action, not stall it.
Focus on the "Vital Few": Don't track 100 metrics poorly. Identify your current stage's 3-5 critical metrics and strategic priorities. Once you're consistently reporting and effectively acting on them, expand to the next batch. Use frameworks like the Balanced Scorecard, but keep it lean (Builtin.com, BCSDesigner.com).
Establish clear ownership: who is responsible for tracking, reporting, and acting upon each key benchmark? Accountability drives progress.
Integrate into your operating cadence: don't treat benchmarking as a separate task. Embed metric reviews into your existing operating cadence (e.g., weekly leadership meetings, monthly business reviews, quarterly board updates) (Comidor.com, EsInli.com).
At MarketShare, focusing on metrics that our teams could impact turned strategy into results, fueling growth and, ultimately, enterprise value.
🔗 Linking Operational Discipline to Efficient Scale
A good measurement process will reveal what's happening; operational discipline will explain why and drive improvement.
Codify your culture: Frameworks like the DuPont Bradley Curve help visualize how safety and operational maturity are linked. Apply this thinking: a culture of discipline, Accountability, and continuous improvement directly impacts performance benchmarks (DuPont Sustainable Solutions).
Standardize where it counts: Implement clear processes (e.g., Conduct of Operations principles) for critical workflows like sales, onboarding, support, and development releases. Standardization reduces errors, improves predictability, and makes scaling smoother. Leadership involvement is key here (Milliken & Company).
Build feedback loops: Implement closed-loop processes. When a benchmark flags an issue (e.g., rising churn), have a defined process to diagnose the root cause, implement corrective actions, and monitor the impact. Regular internal audits or process reviews are crucial.
Operational excellence is a mindset that needs to get embedded in your company culture. Understanding performance against benchmarks will help.
🙋♂️ Benchmarking can rally your troops to the cause
Numbers don't lead people; people lead people. How does benchmarking fit into your operating model?
Metrics as tools for empowerment: Benchmarks should provide teams with the information they need to understand their impact, make better decisions, and see progress. They are tools for enablement, not judgment.
Transparency builds trust: Share relevant benchmarks openly (within reason) and explain the why behind them. When people understand the goals and how their work contributes, engagement increases.
Data-informed coaching: Use performance data not for criticism, but as a starting point for supportive coaching conversations.
Celebrate progress, not just perfection: Recognize improvements and milestones achieved based on benchmarked data. This will reinforce positive behaviors and build momentum.
How can you use benchmarking data to better serve, support, and develop your team members?
💪 Benchmarking helps demonstrating value
Effective benchmarking isn't just an internal tool; it's also crucial for external communication, particularly with investors and board members.
Translate Operations into Value: Show how operational improvements and strong benchmarks (NRR, CAC:LTV, Gross Margin) directly translate into increased enterprise value, lower risk, and a more compelling investment thesis.
Build Credibility: Consistently hitting or thoughtfully explaining deviations from benchmarked targets builds immense credibility. It shows you understand your business levers. My experience helping ServiceTitan elevate board meetings focused on strategic topics, backed by solid data from our newly created audit committee, built significant trust.
Demonstrate Scalability: Use benchmarks to prove your business model is scalable and your unit economics hold up (or improve) with growth. This is critical for securing funding at favorable valuations.

Final Thought
Are the benchmarks for your metrics available all in one place? Probably not. You will need to piece them together from multiple sources, but with today's advancement with AI agents, it's easier than ever, but triple check your sources to ensure there aren't any hallucinations!
That said, while I’m big advocate of AI in the workplace, in this case, I would actually recommend you err on this side of caution and use curated data sources. Here are a few places to get you started:
Quick Hits: What's On My Radar
Trend: Open source continues to make AI more affordable and accessible. Meta recently released Llama 4 and Alibaba just announced Qwen 3. They continue to challenge the closed models and I may write a post on how to use them at work.
New App: Gamma. Gamma is a browser-based “AI design partner” that turns a short prompt, pasted outline, file, or URL into fully formatted presentations, one-page websites, social posts, and documents in seconds. Under the hood, it taps a stack of more than 20 LLM and image models to draft copy, choose layouts, pull or generate visuals, and keep everything on-brand, so you start with a finished first draft instead of a blank slide..
Number to Know
40%+
That’s the percentage of times unassisted LLMs still produce inaccurate results when analyzing complex financial data. Despite improvements in tests and benchmarks, we’re still in a “Trust but Verify” period.
Until next Tuesday, 👋
JP